 The System Statistics Report provides an overall view of the data within your WCONLINE site. It should be considered the primary comprehensive data report within the program. In essence, this report counts all countable data across your registration, appointment, client report, and survey forms and presents that data in graphical format. It can be customized and limited in a variety of ways, allowing you to produce an overview of your data in the way that is most meaningful to your center.
The System Statistics Report is accessed via the System Statistics Report under the "System Utilities & Reports" section of the Welcome menu, and is typically available to full administrators only. The report is divided into several sections. Select a section title in order to go to the manual entry that discusses the named section.
- REPORT LIMITS: These are the options at the top of the System Statistics Report that allow you to define and configure the report's display (such as defining the report's date range).
- SUMMARY AND GLOBAL STATISTICS: These statistics aren't direct reports of data stored on your forms; rather, these sections provide overall statistics related to the days and times most utilized, the busiest schedules and resources, and total numbers of appointments, registrations, client reports, and surveys entered on your system.
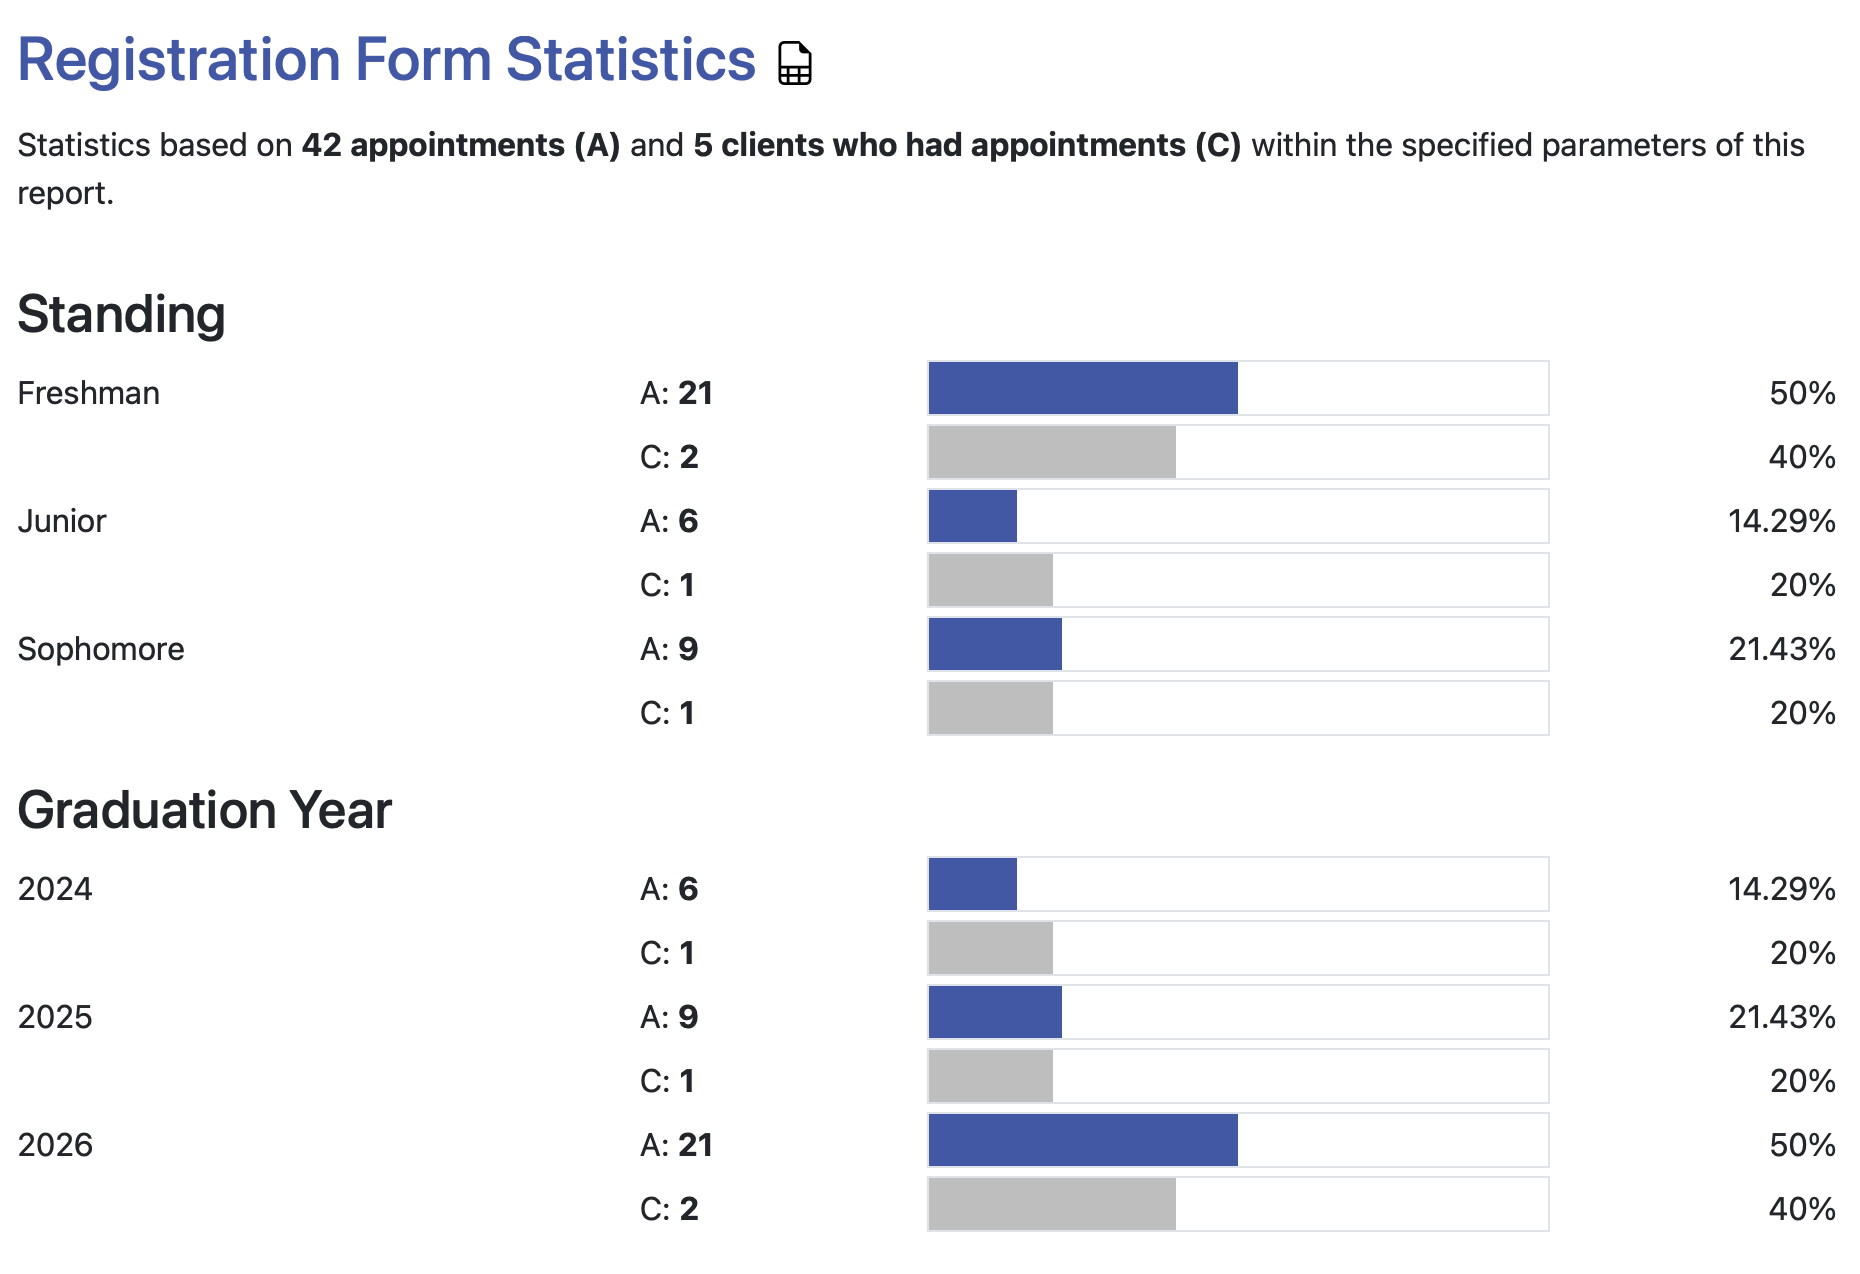
- REGISTRATION, APPOINTMENT, CLIENT REPORT, AND SURVEY FORM STATISTICS: These statistics look at each individual form and report back on the countable answers that have been selected on the registration, appointment, client report, and survey forms.
![]() While the report is designed to be manipulated on your screen, it has been programmed to allow for printing. If you choose your browser's "print" function (typically found in the "File" menu), you'll find that the printed report contains only the report data and appropriate titles. Should you wish to work with the raw data that WCONLINE uses to put together the report, select the spreadsheet icon to the right of a section label to download the data from that section as an Microsoft Excel .xlsx file or use the System Data Export tool to download all of your raw data.
While the report is designed to be manipulated on your screen, it has been programmed to allow for printing. If you choose your browser's "print" function (typically found in the "File" menu), you'll find that the printed report contains only the report data and appropriate titles. Should you wish to work with the raw data that WCONLINE uses to put together the report, select the spreadsheet icon to the right of a section label to download the data from that section as an Microsoft Excel .xlsx file or use the System Data Export tool to download all of your raw data.
Sections in this Chapter
SECTION 1: Configuration Options
SECTION 2: Summary, Global, and Time & Date Statistics
SECTION 3: Registration, Appointment, Client Report, and Survey Statistics