Directly below "Time & Date Statistics" on the System Statistics Report (which you'll find under the "System Utilities & Reports" section of the Welcome menu), you'll find separate sections that report on the data collected on your Registration, Appointment, Client Report, and Survey forms. You can also access these sections by selecting "REGISTRATION," "APPOINTMENT," "CLIENT REPORT," or "SURVEY" within the "JUMP TO" links under General Statistics.
Understanding the Display
With just a few exceptions (as noted below), the registration, appointment, client report, and survey sections report data in the same way and within the larger configuration options (such as date range) selected at the top of the report.

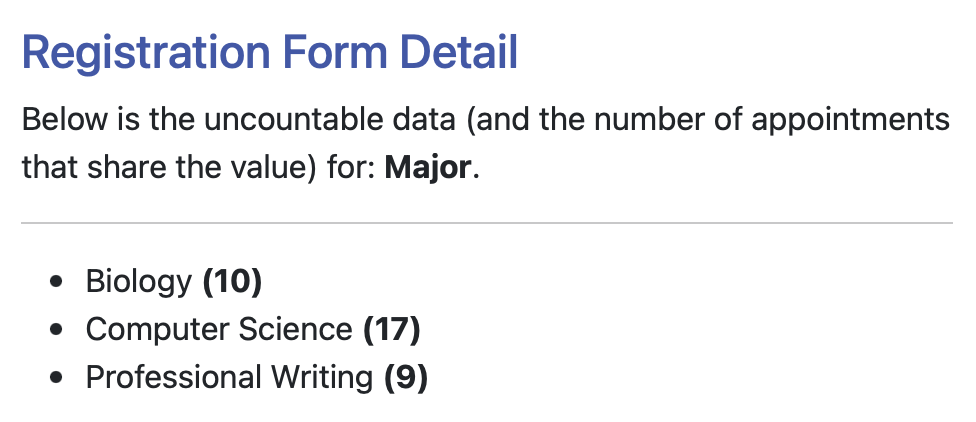
Using the example above, "Is this for a composition course?" is one of the questions that you've added to the registration form. Questions are added in Form Setup: Registration Form, Form Setup: Client Report Form, Form Setup: Appointment Form, and Module Setup: Survey in your Welcome menu. Only questions that are countable can be turned into graphs. Specifically, questions answered with a checkbox, multiple checkbox, drop-down, or Likert response are countable, while fill-in and large "textarea" responses are freeform and not countable.
Continuing with the example, "No" and "Yes" represent the selected answers to the "course" question. Here, 12 appointments had this question answered with "No" and 3 had this question answered with "Yes." The percentages and graphs that follow the answers show the percentage of clients that selected each option.
Note that the total here (15) might be lower than the total number of appointments listed at the top of the System Statistics Report. Only appointments for which this question was answered will appear as a number here. For example, even if this question was a required question, administrators, who do not have to complete required questions, could have made five appointments without answering this question. As a result, the total number of appointments at the top would be correct when displaying 17, while the combined total here of 12 would also be correct in that that's how many appointment forms within the larger number had this question answered.
A couple of answer types require more explanation:
- If a question is answered by checking a single checkbox, then the report will display "CHECKED" and "NOT CHECKED" as the "answers" that are counted and graphed.
- If a question is answered by selecting multiple checkboxes, then the report will display the number of times that each checkbox answer was selected. For example, if a checkbox offered "blue," "yellow," and "green," and if someone selected "blue," and "green" on the same form, then that would be counted as one "blue" answer and one "green" answer. This means that you'll likely have more selections than total number of forms submitted for this type of answer response.
- If a question is answered by a Likert response, then the report will display point values for each Likert option (Strongly Agree = 5, Agree = 4, Neutral or Neither agree nor disagree = 3, Disagree = 2, and Strongly Disagree = 1) and then will display the average of all of the responses. For example, if five students answered the question with "Strongly Agree" and two students answered the question with "Disagree," then total points attributed to the answers would be (5 * 5) + (2 * 2) = 29. Additionally, the average of the answers would be 29 / 7 = 4.14.
 Finally, if you have fill-in or large response "textarea" questions on your forms, you can still see those responses from the System Statistics Report. To do so, scroll to the bottom of the section that covers the form (such as to the bottom of your [Form] Statistics if the question is on your registration form). Then, under the "The following questions on your registration form are answered via fill-in responses that cannot be counted." heading, select one of the listed questions. A window will then open that displays the answers that have been entered on the form within the configuration options and date range selected. If the same answer has been entered multiple times, those identical answers will be grouped and a total number will be displayed.
Registration Statistics
This section shows graphs for answers to countable questions on your registration form. Each answer is shown as both a percentage of total unique clients and as a percentage of total appointments with that answer selected.
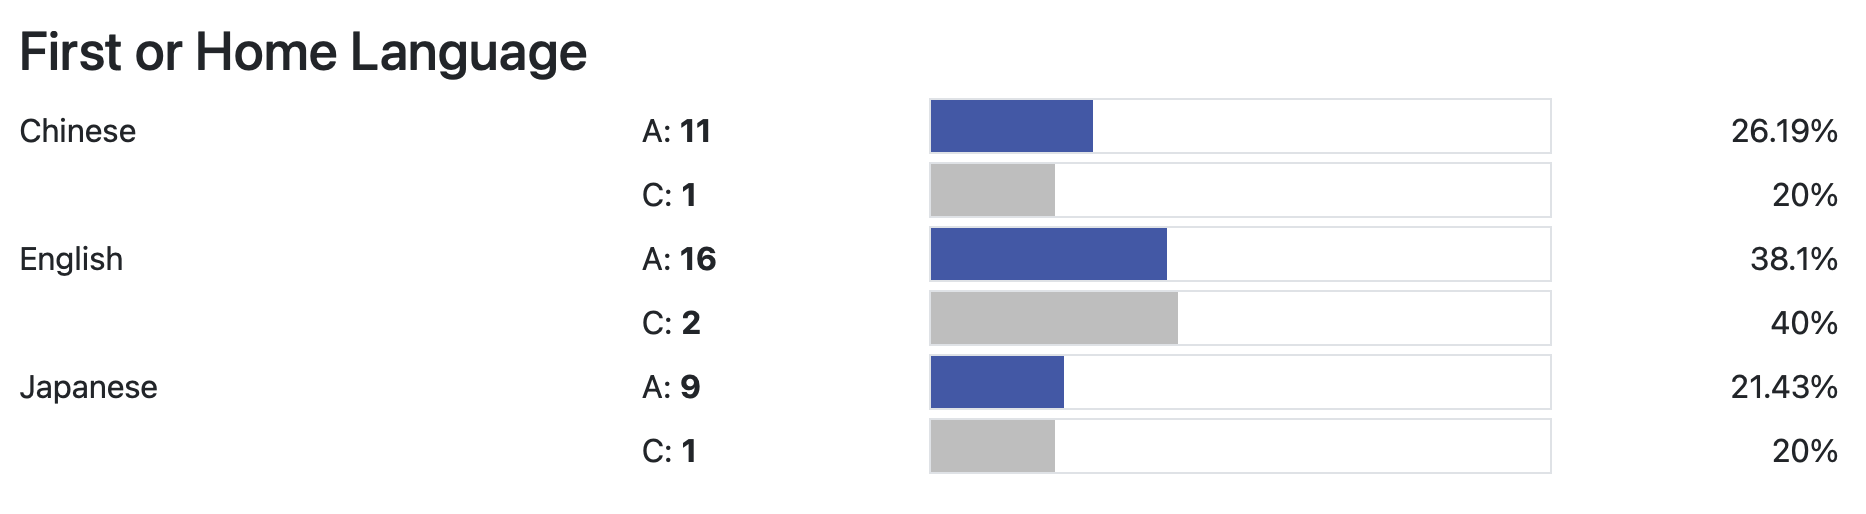
The example above shows what your report might look like when providing statistics for a "First or Home Language" question on your registration form (that is answered via a selection from a drop-down). The leading line states that "Statistics based on 36 appointments and 4 clients who had appointments within the specified parameters of this report." Turning to the graph, this means that 11 appointments (displayed as "A:") out of those 36 were for clients who had answered the standing question as "Chinese." But, all 11 appointments were made by just 1 unique client (displayed as "C:").
Appointment Statistics
This section shows graphs for answers to countable questions on your appointment form. Each answer is shown as a percentage of total appointments with that answer selected. If you have SELECT BY FOCUS? set to REQUIRED in Schedule Management, then this section will also include an "Appointments by Focus" area that shows statistics on appointment form focus selections.
Client Report Statistics
This section shows graphs for answers to countable questions on your client report form. Each answer is shown as a percentage of total client report forms with that answer selected. If you use off-schedule client report forms, then the section will also include a second line that shows the number of off-schedule client report forms with that answer selected.
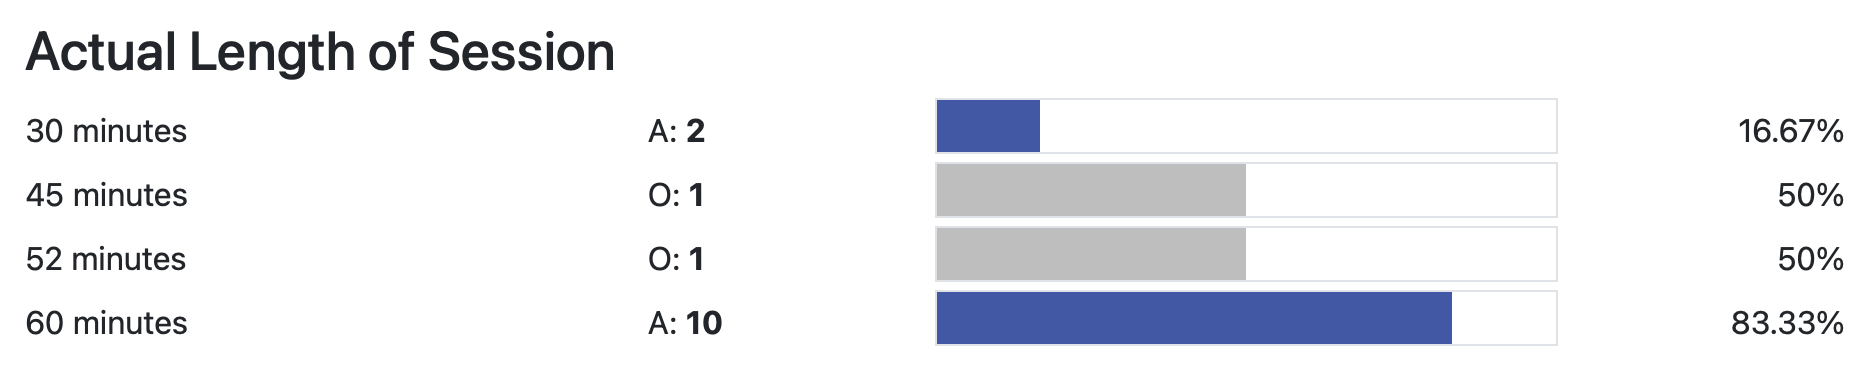
The example above shows what your report might look like when providing statistics for the "Actual Length of Session" question on your client report form (that is answered via a drop-down option). The leading line states that "Statistics based on 12 client report forms (labeled "A:") and 1 off-schedule client report form (labeled "O:") within the specified parameters of this report." Turning to the graph, this means that the "30 minutes" option was selected twice on client report forms attached to appointments, and the "45 minutes" option was selected once on an off-schedule client report form.
Survey Statistics
This section shows graphs for answers to countable questions on your survey form. Each answer is shown as a percentage of total surveys with that answer selected. If you have RECORD STAFF OR RESOURCE? set to "Yes: Required." in Module Setup: Survey, then this section will also include a "Surveys by Staff or Resource" area that shows statistics on survey form staff or resource selection.
Since surveys are anonymous and not attached to a client or schedule, the client and schedule configuration options do not apply to this section. The staff or resource configuration option also does not apply unless the selection of staff or resource is required.
Sections in this Chapter
SECTION 1: Configuration Options
SECTION 2: Summary, Global, and Time & Date Statistics
SECTION 3: Registration, Appointment, Client Report, and Survey Statistics